

It's 3:17 AM. Your phone erupts with alerts.
Robot #73, a critical unit at a high-value customer site a thousand miles away, has gone offline.
The operations team is already pinging Slack. Management will be awake soon. The SLA clock is ticking.
You know the drill by heart:
- SSH into the machine (if it's still reachable)
tail -fthrough a dozen log files- Grep for error messages in an ocean of INFO spam
- Try to reconstruct the robot's final moments from sparse telemetry
Was it hardware? Software? A sensor feeding garbage? A race condition that only manifests at customer sites?
Six hours of remote debugging later, or worse, an expensive on-site visit, you finally find the culprit.
The damage is done: downtime costs, frustrated customers, and a team running on fumes.
This isn't a sign of bad engineering. It's a symptom of hitting the Observability Wall.
What Is the Observability Wall?
The Observability Wall is the breaking point where your fleet's complexity fundamentally outstrips your ability to understand what's happening inside it.
It's not a question of if you'll hit it. It's a question of when.
The Scaling Problem
With a single robot in a controlled lab, traditional debugging works:
- Attach
gdbto inspect processes - Use
ros2 topic echoto monitor messages - Manually correlate logs
But scale to 10, 50, or 500 robots operating across different sites, environments, and network conditions?
That workflow collapses.
Suddenly, you're not debugging a robot. You're trying to reconstruct a crime scene from scattered evidence, with no forensic tools and a ticking clock.
Why Robots Are Different: Bits Manipulating Atoms
Traditional Software = Predictable World
Your web service runs in a data center with known constraints:
- Fixed CPU and memory
- Stable network conditions
- Controlled environment
When it fails, the root cause is usually in the code, database, or API.
Robots = Physical Reality
Robots operate in an entirely different domain: the messy, unforgiving physical world.
Software bugs are only one layer. You also have:
- Sensor drift and noise: A LiDAR covered in dust, a camera blinded by sun glare
- Mechanical wear: Motors degrading over thousands of hours, wheels losing grip
- Environmental chaos: Rain, fog, unexpected obstacles, RF interference
- Configuration drift: That one robot running an older firmware version nobody remembered
The Core Challenge
At a fundamental level, a robot never truly knows its state. It only maintains a belief about where it is and what's around it.
This is called partial observability, and it's a permanent feature of the domain, not a bug you can fix.
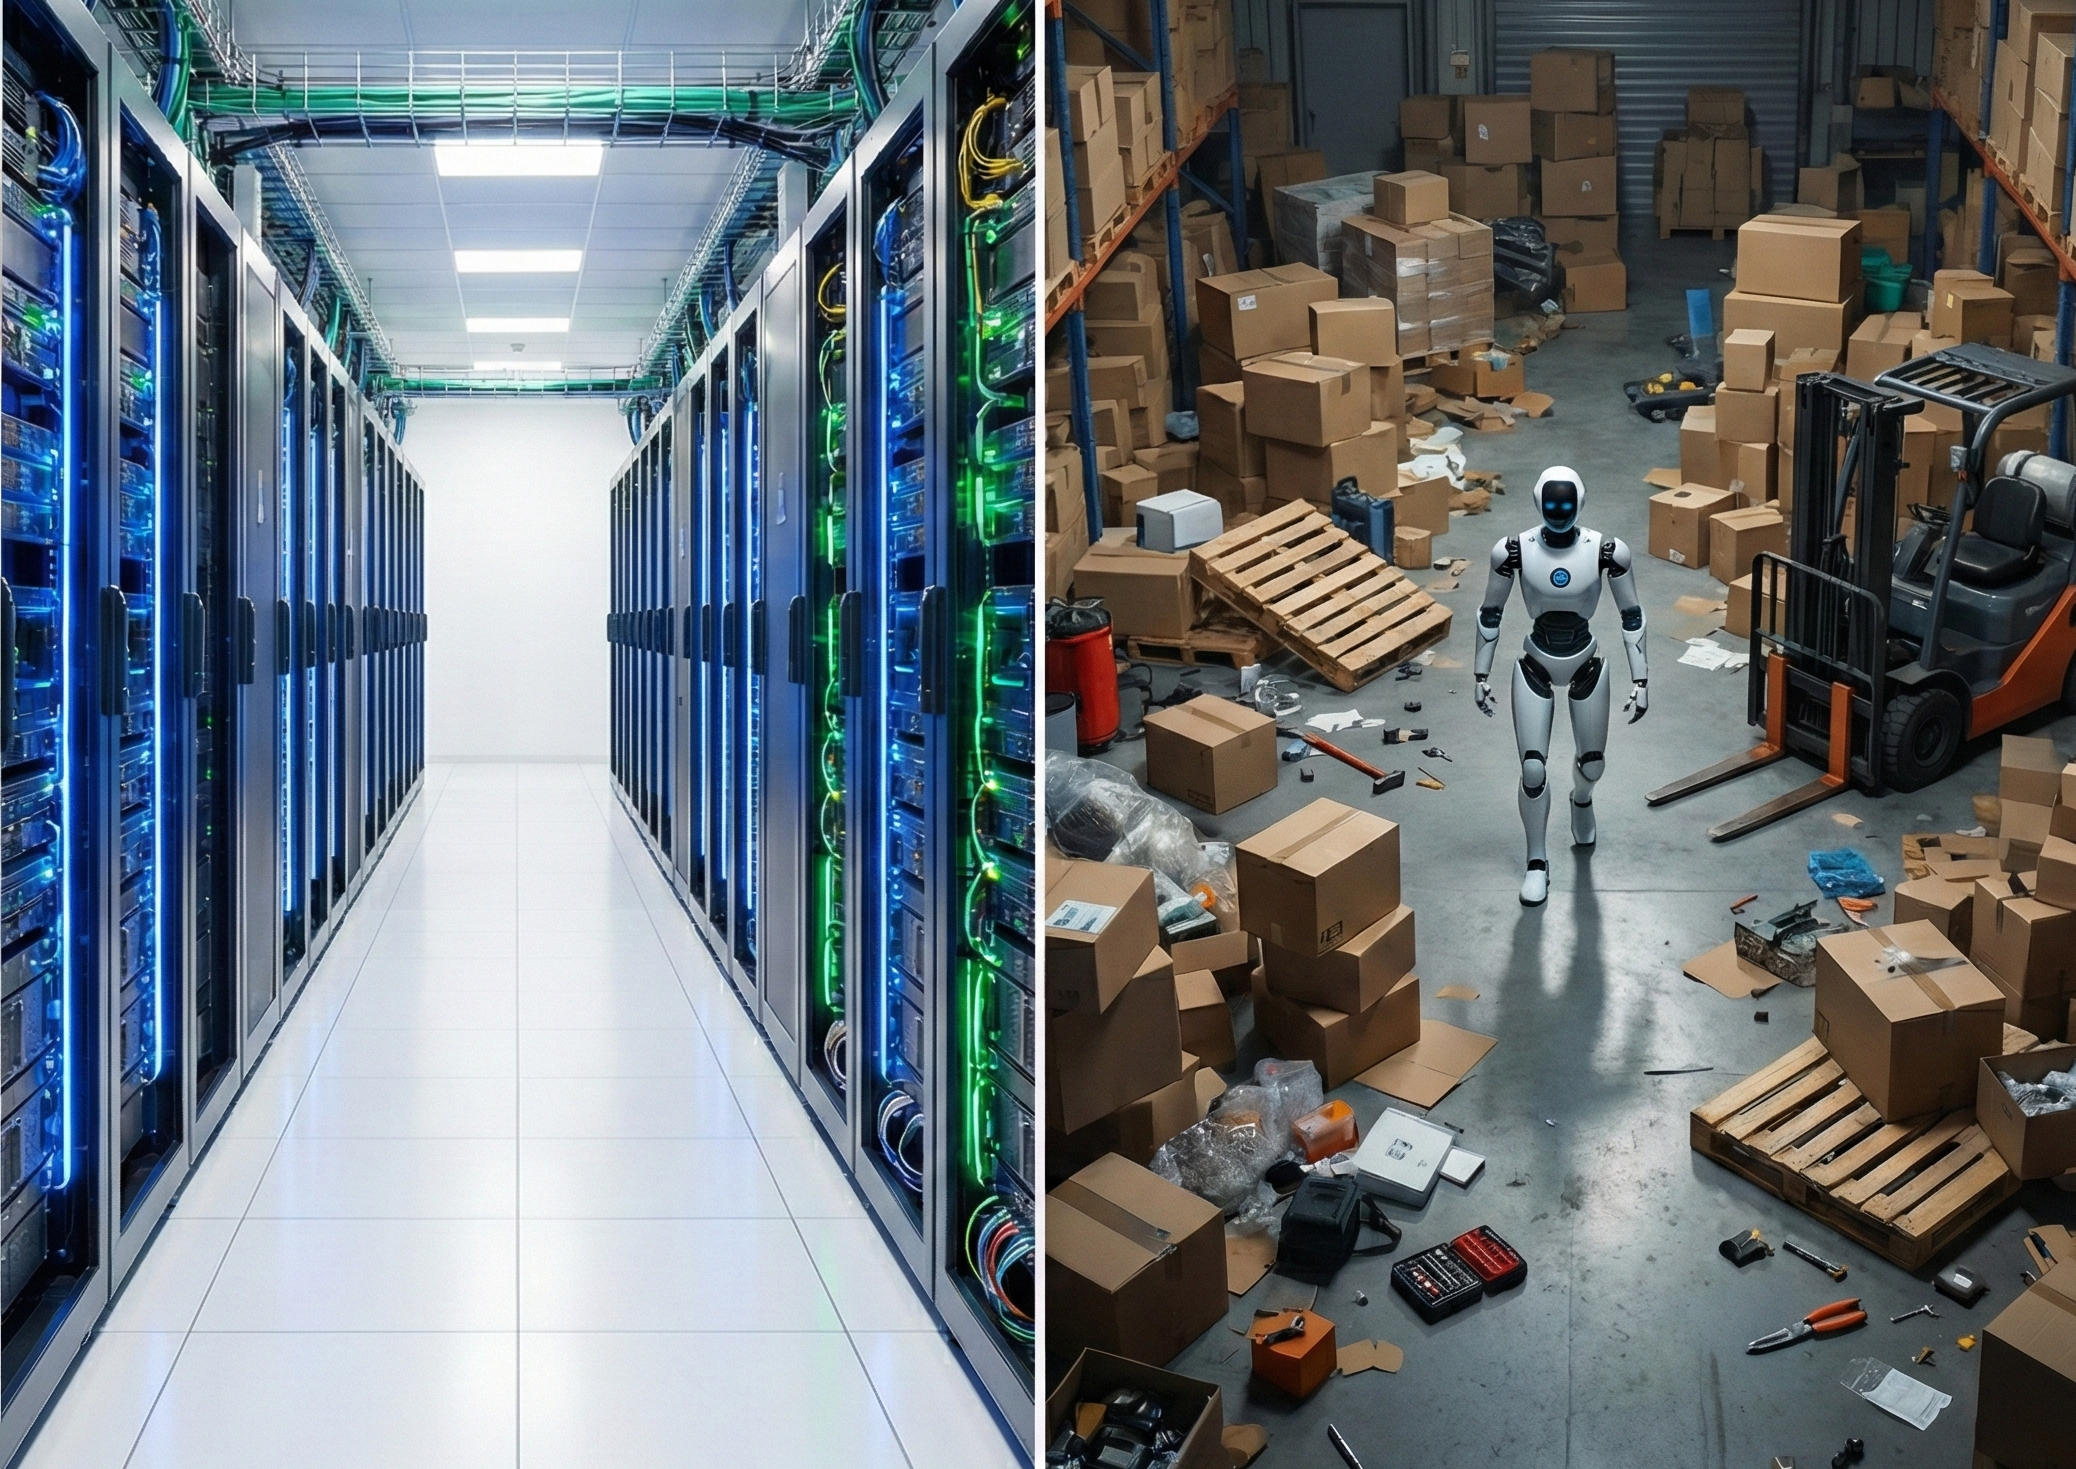
The Bottom Line: When you debug a system that's inherently uncertain, operating in a high-dimensional state space, with multimodal sensor data, using tools designed for structured JSON logs. You've brought a road map to a hurricane.
Four Layers of Blindness
The Observability Wall isn't one problem, it's four compounding challenges that create operational paralysis:
| Layer | Core Problem |
|---|---|
| Data Deluge | Too much data, not enough bandwidth |
| Context Chasm | Scattered information across systems |
| Fragmented Toolkit | Disconnected debugging tools |
| Uncertainty Principle | Exponential complexity from sensor noise |
1. The Data Deluge
The Volume Problem: A single robot generates gigabits per second:
- High-res camera feeds
- Dense LiDAR point clouds
- IMU readings at 1kHz
- System telemetry and logs
The Bandwidth Reality: Your robot operates with:
- 100 Mbps shared warehouse connection
- Spotty 4G in remote locations
- Zero bandwidth in rural farms
The Impossible Choice:
- Downsample aggressively -> Lose critical debugging context
- Keep full-resolution data -> Stranded on edge device, inaccessible
Result: You're simultaneously data-rich and information-poor.
2. The Context Chasm
Robot failures are never simple. They're the intersection of multiple factors:
| Domain | Key Questions |
|---|---|
| 💻 Software | Which ROS node crashed? |
| 🔧 Hardware | Which sensor firmware was running? |
| 🌧️ Environment | Was it raining? Was the floor wet? |
| 📋 History | Has this happened before? |
Where This Context Lives Today:
- 📦 Operational data -> ROS bags
- 📊 Hardware specs -> Spreadsheets
- 🔀 Software versions -> Git
- 💬 Incident notes -> Jira/Slack
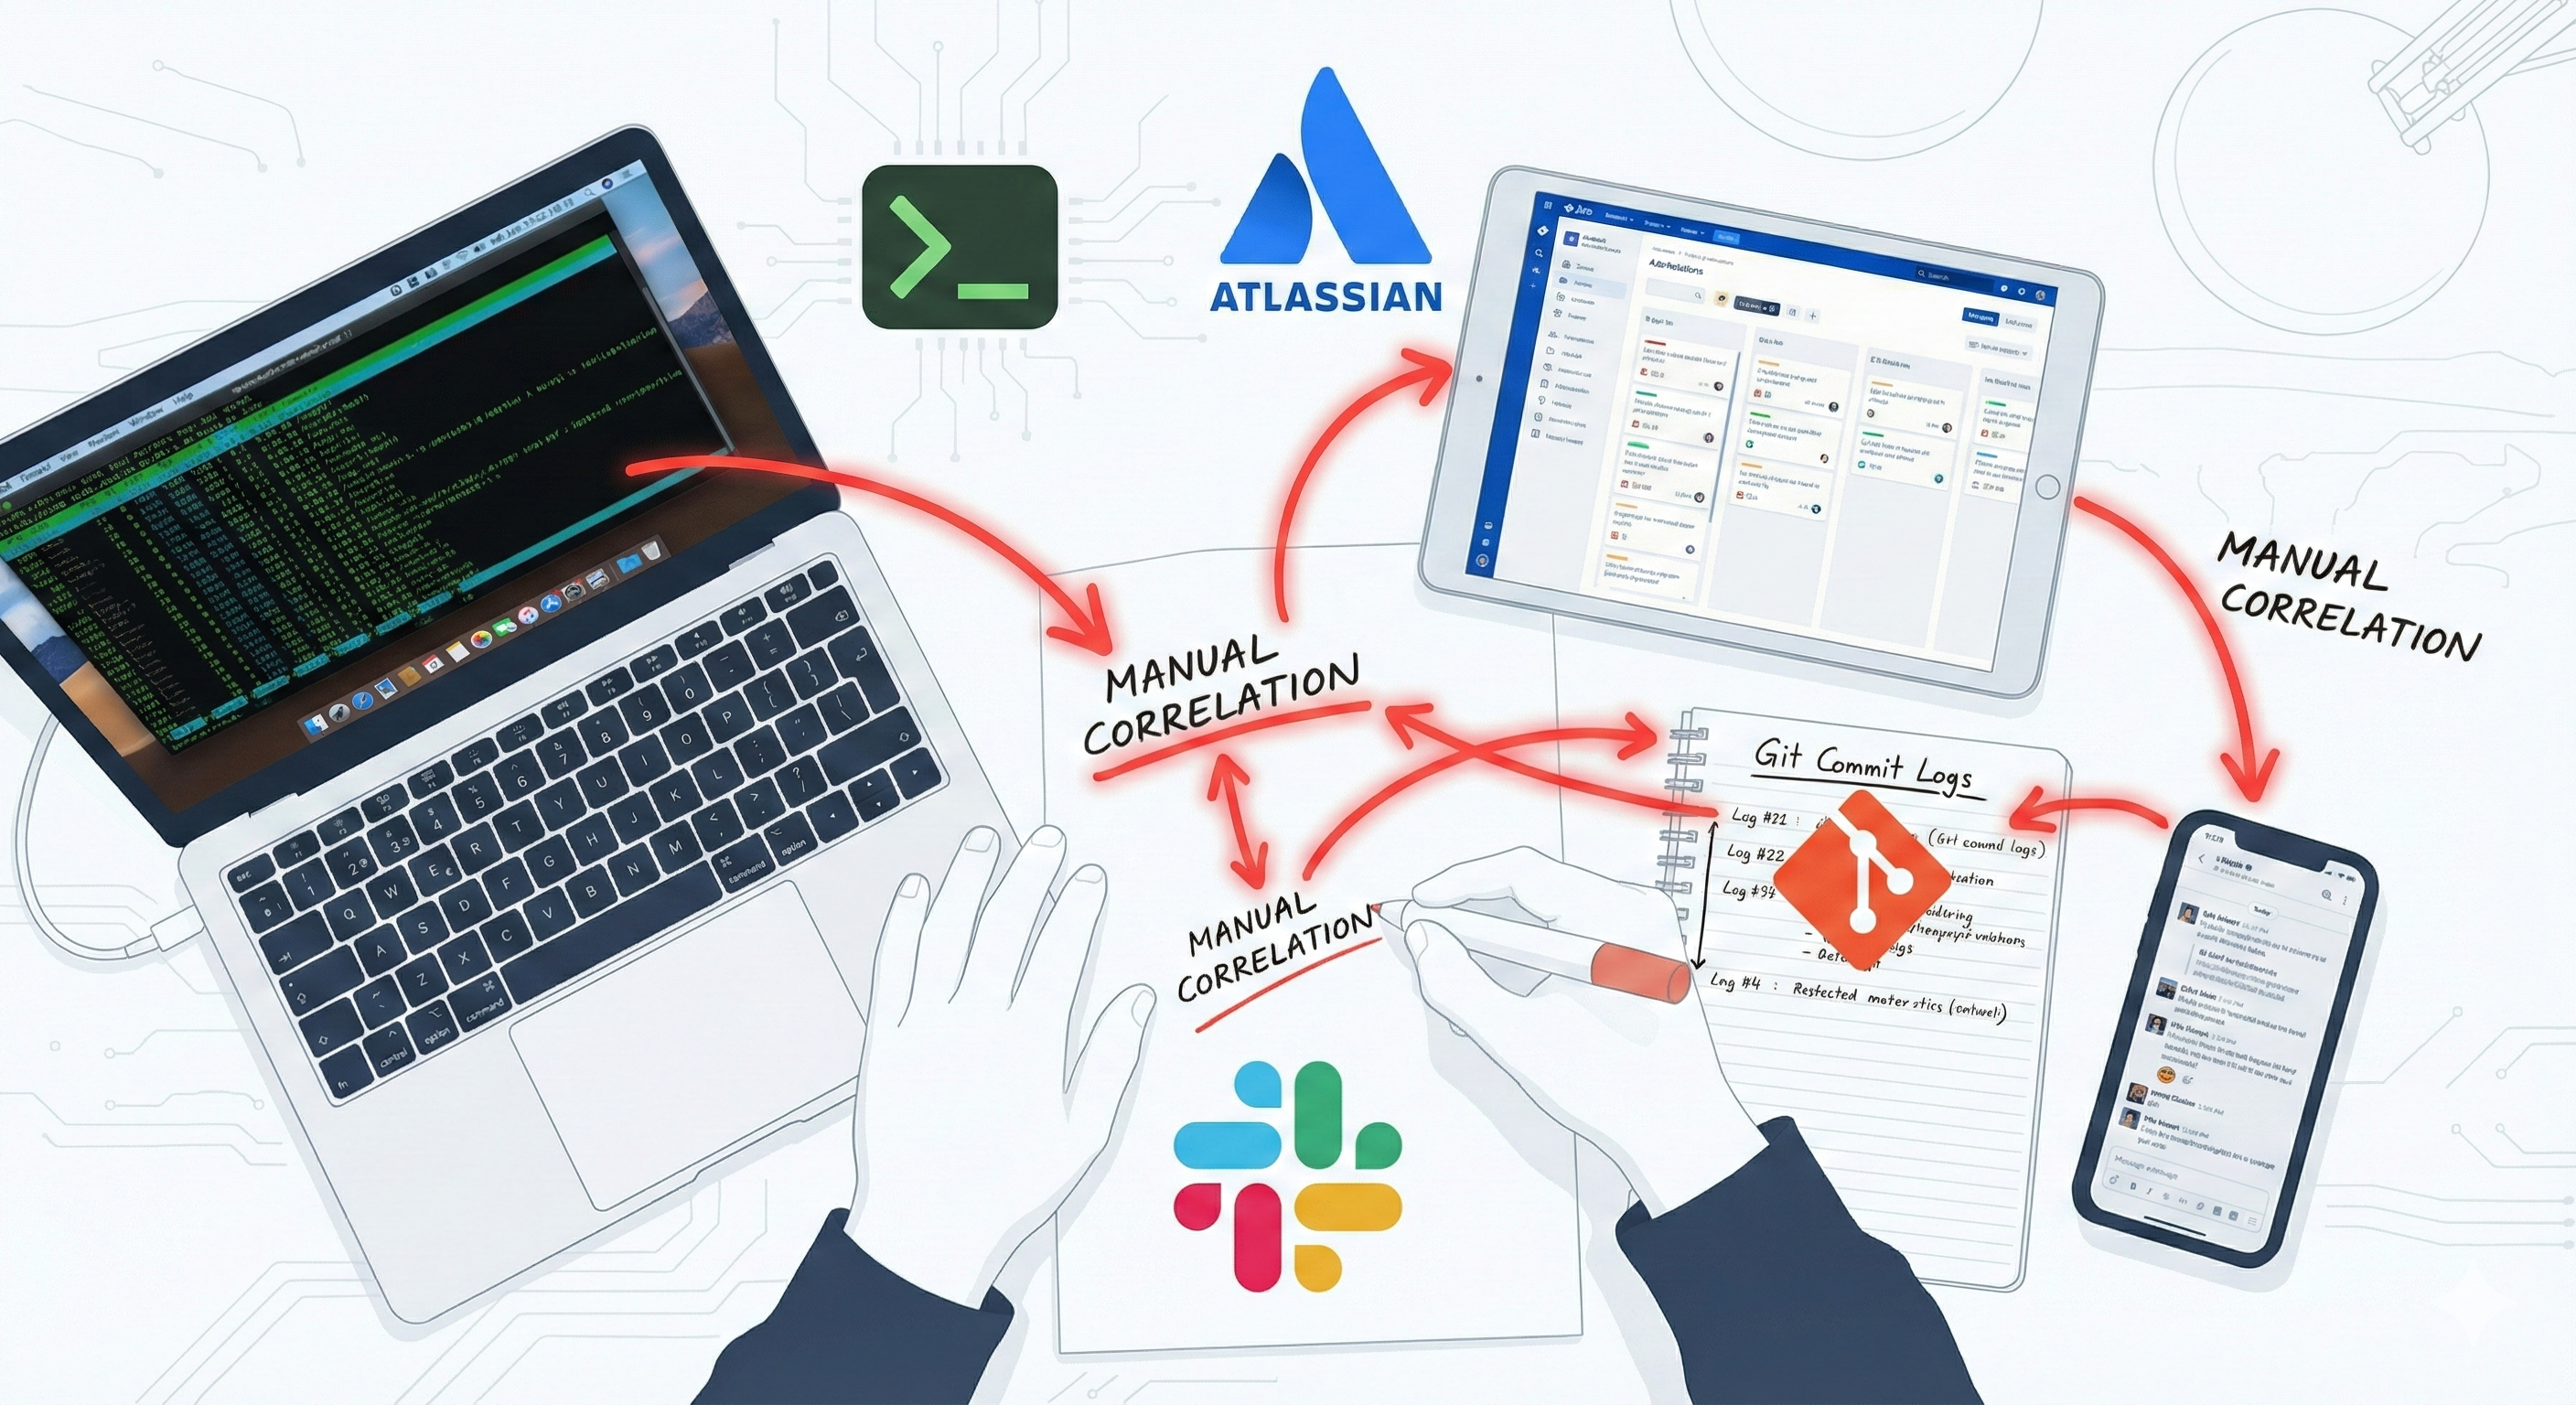
The Problem: You become a human data aggregator, manually piecing together fragments across six different systems.
This fragmentation turns a 30-minute fix into a 6-hour investigation.
3. The Fragmented Toolkit
The standard ROS2 debugging workflow is powerful, for a single developer in a lab:
ros2 topic echoto inspect messagestf2_echoto debug transformsgdbfor segfaults (after recompiling with debug flags)- Custom scripts to parse logs
Each tool provides one piece of the puzzle. But there's no unifying layer that preserves context across tools or across time.
When an incident occurs in the field, all that rich, interconnected context collapses. You're left with static snapshots: a bag file here, a core dump there, scattered logs everywhere.
You spend 80% of your time reconstructing what happened, and only 20% actually fixing it.
4. The Uncertainty Principle
At the deepest level, robotics is a game of managing uncertainty. Every sensor is noisy. Every actuator has latency. The environment is always changing.
This creates exponential complexity:
- Sensory degradation: Fog obscures vision, rain corrupts LiDAR returns
- Perceptual aliasing: Long hallways all look the same, localization fails
- Dead reckoning drift: Odometry errors accumulate over time, diverging across robots
In academic terms, this is the "curse of dimensionality." The number of possible failure modes grows exponentially with system complexity.
Without proper observability, you're searching for a needle in a haystack that's growing exponentially with every new sensor, every new feature, every new deployment site.
The Business Cost: MTTR and the Downtime Multiplier
These technical challenges aren't just engineering frustrations. They directly impact your bottom line.
The Metric That Matters
Mean Time To Recovery (MTTR): Average time from failure detection to full service restoration.
The Numbers Are Brutal
| Impact | Scale |
|---|---|
| 💸 Cost per hour | Up to $260,000 in manufacturing |
| ⏱️ Downtime | 5-20% of scheduled production time |
| 📊 Frequency | 82% of companies hit annually |
What High MTTR Actually Costs
💰 Lost Production
- Idle robots
- Idle workers
- Missed shipments
⚖️ SLA Penalties
- Contractual fines
- Uptime violations
🔥 Burned-Out Engineers
- Best talent firefighting, not innovating
- 3 AM debugging sessions
📉 Customer Churn
- Trust is hard to earn
- Easy to lose
Here's the brutal connection: The "curse of dimensionality" in robotics directly increases MTTR. When your engineer has to manually search an exponentially growing problem space with fragmented tools, every extra hour of debugging is a direct tax on your business.
This is the Cost of Uncertainty, and it shows up on your P&L whether you measure it or not.
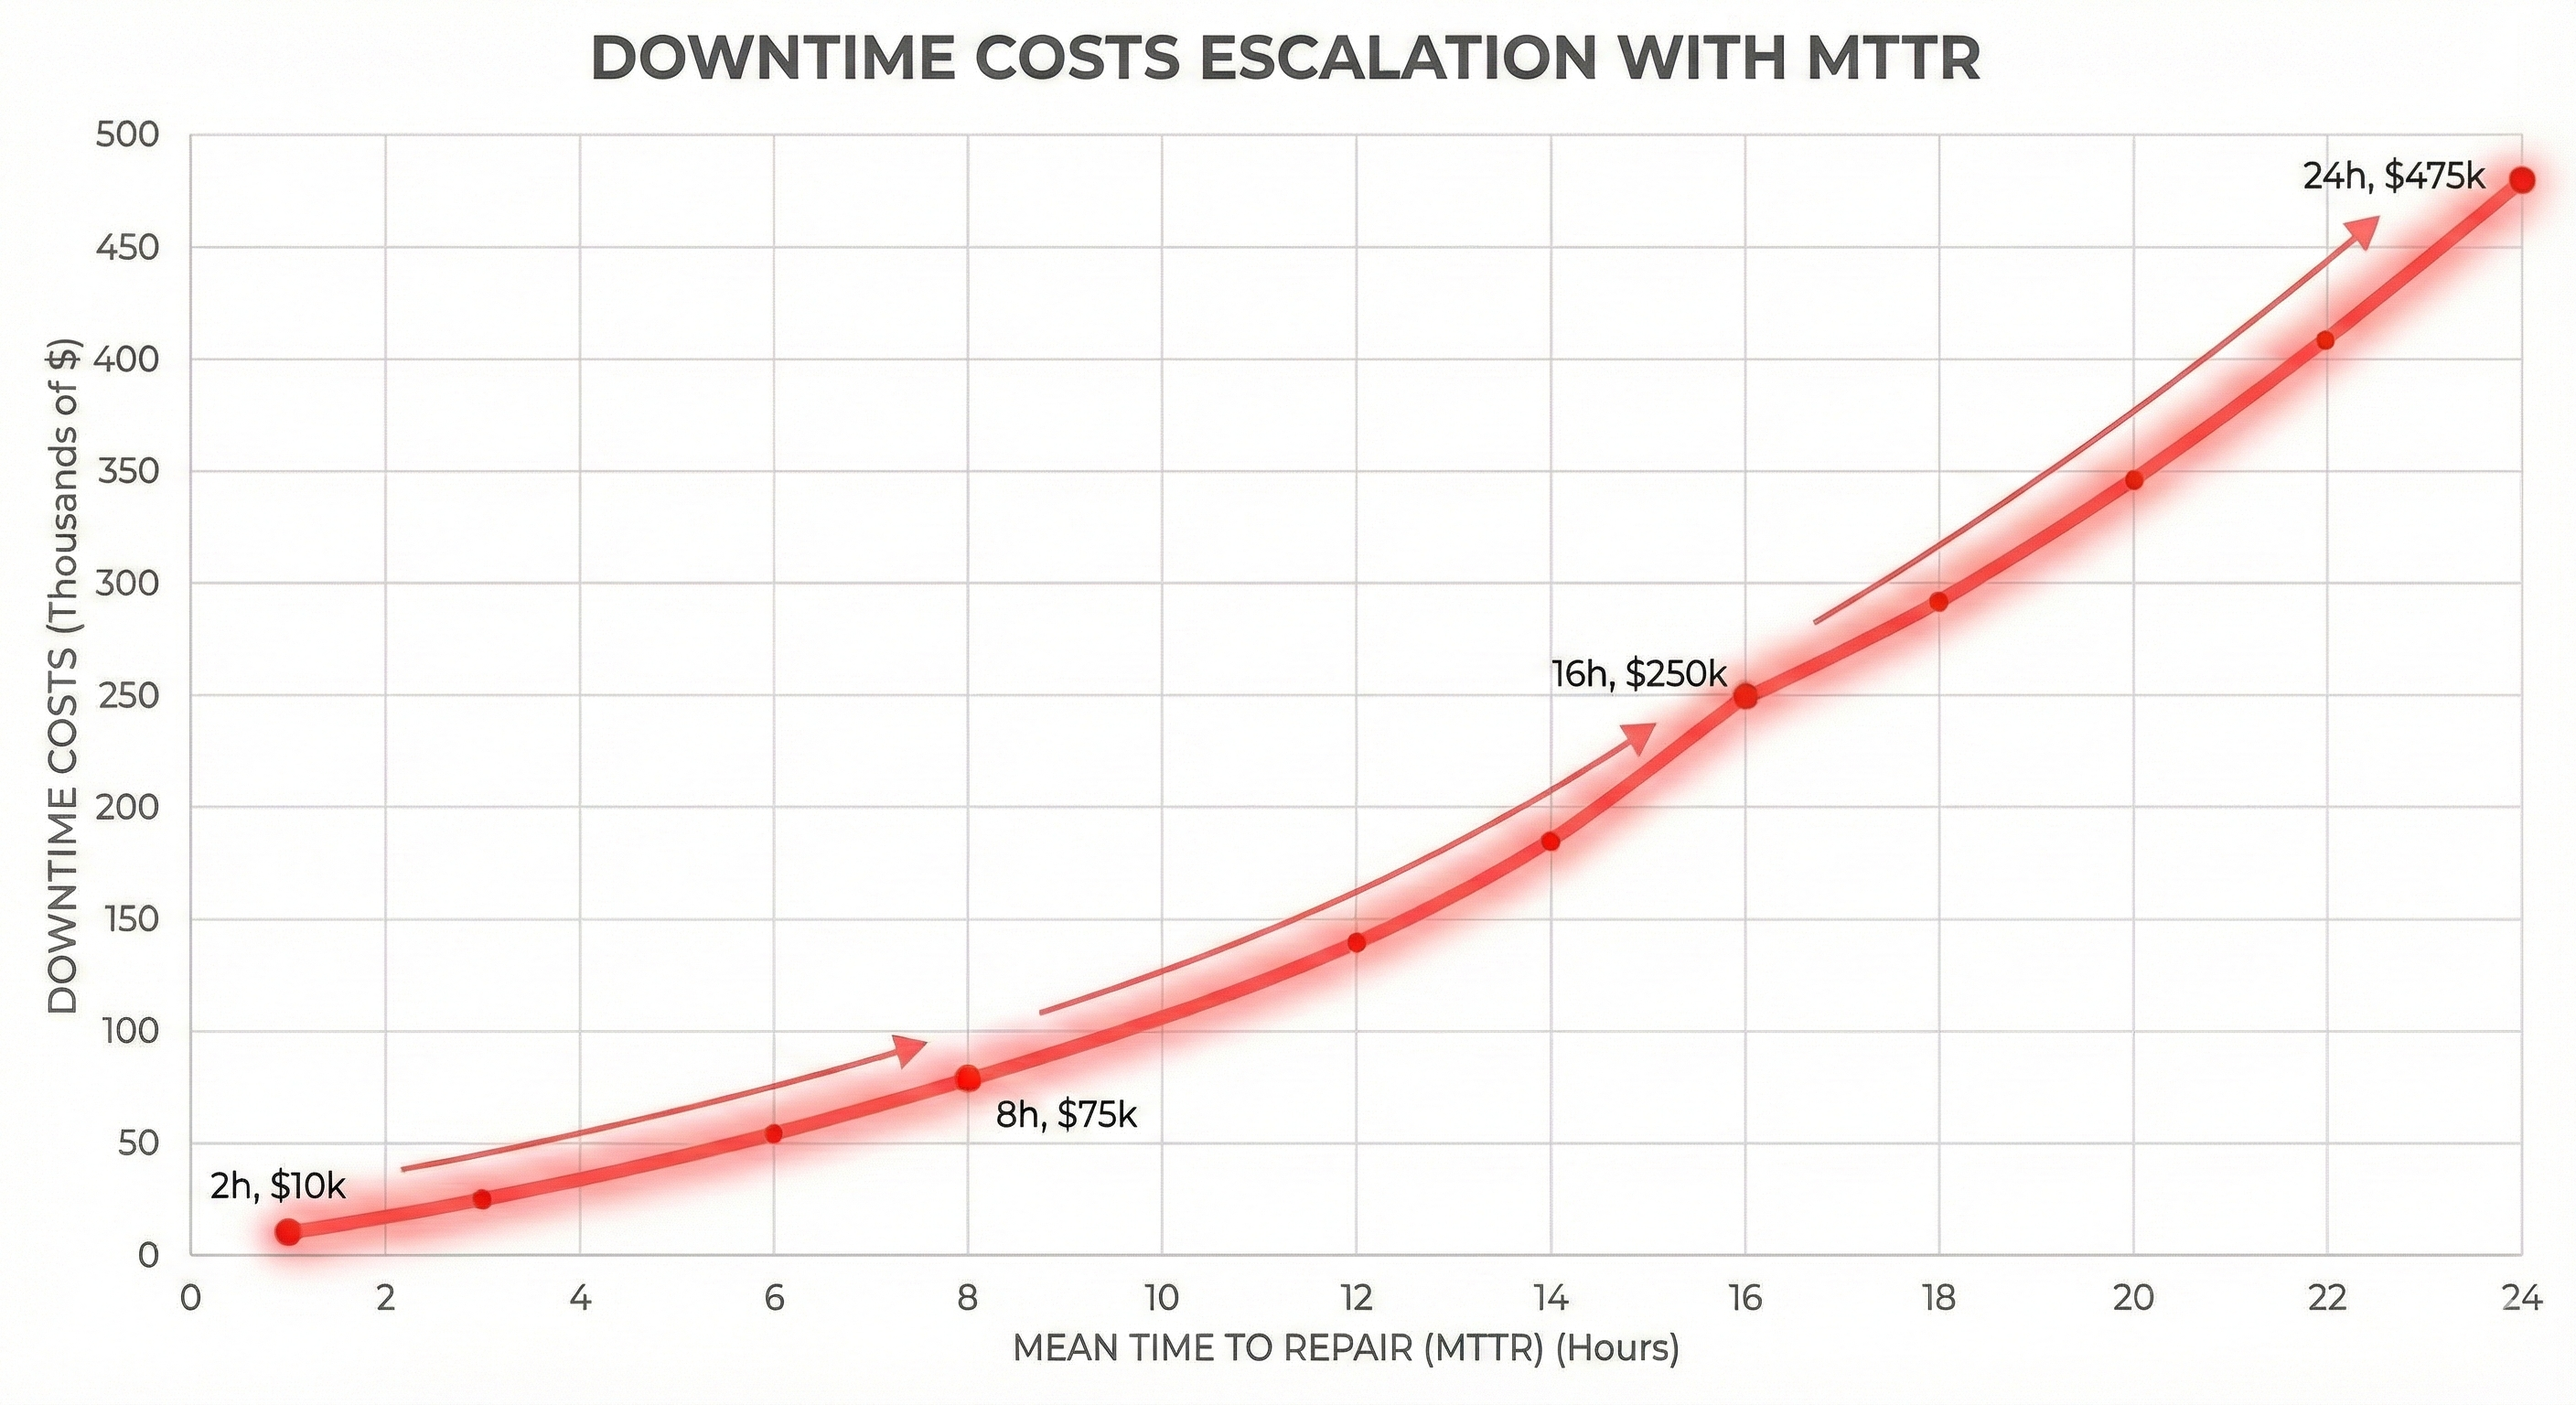
The Observability Wall isn't theoretical, it's a guaranteed milestone.
Breaking Through the Wall
The Reality Check: Operating a ROS2 fleet without dedicated observability means you're flying blind.
You're gambling that the next critical failure won't happen:
- ⏰ During peak hours
- 🏢 At your most important customer
- 🔒 In a way that's impossible to debug remotely
The Truth About the Observability Wall
✅ It's real
✅ It's expensive
✅ It's inevitable
✅ It's also solvable
What You Actually Need
The solution isn't better logging discipline or more SSH sessions.
You need a purpose-built observability platform:
| Capability | What It Solves |
|---|---|
| 🎯 Intelligent Data Management | Capture at edge, sync on-demand |
| 🔗 Unified Context | One place for telemetry, hardware, software, history |
| ⏪ Time-Travel Debugging | Replay incidents with full sensor context |
| 👁️ Fleet-Wide Visibility | Monitor hundreds of robots from one dashboard |
One Question
The last time a critical robot failed in the field, how many hours did your team lose just reconstructing what happened?
How much did that cost?
It's Time to Tear Down the Wall
INSAION is built from the ground up to solve the Observability Wall for ROS2 fleets. From rolling buffers and on-demand sync to AI-powered diagnostics, we give you the visibility and context you need to keep your fleet running.