

Insaion v1.1.19: OpenTelemetry Is Here
This release is about freedom.
With Insaion Agent v0.8.4, Insaion now supports OpenTelemetry (OTel) metrics, logs, and traces end-to-end. You can instrument your application with official OTel SDKs in your preferred language and send telemetry directly into Insaion without vendor lock-in.
No proprietary schema to learn. No platform-specific SDK migration.
Just open standards, production-ready tooling, and faster root-cause analysis.
Open Standards, No Lock-In
The v0.8.4 agent now accepts OTel traffic through the OTLP pipeline and maps incoming data into Insaion's telemetry model for routing and analysis.
In practical terms, this means:
- Metrics arrive as OTel instruments and are ingested as first-class monitoring signals.
- Logs are ingested through the same OTel path, preserving service-level context.
- Traces are captured as spans, events, and links so distributed request flow is queryable in the dashboard.
This approach keeps your instrumentation portable. If you already use OTel in Python, C++, Rust, Go, Java, or Node.js, you can keep using the same libraries and semantics.
New Tracing Workflow: From Signal to Root Cause
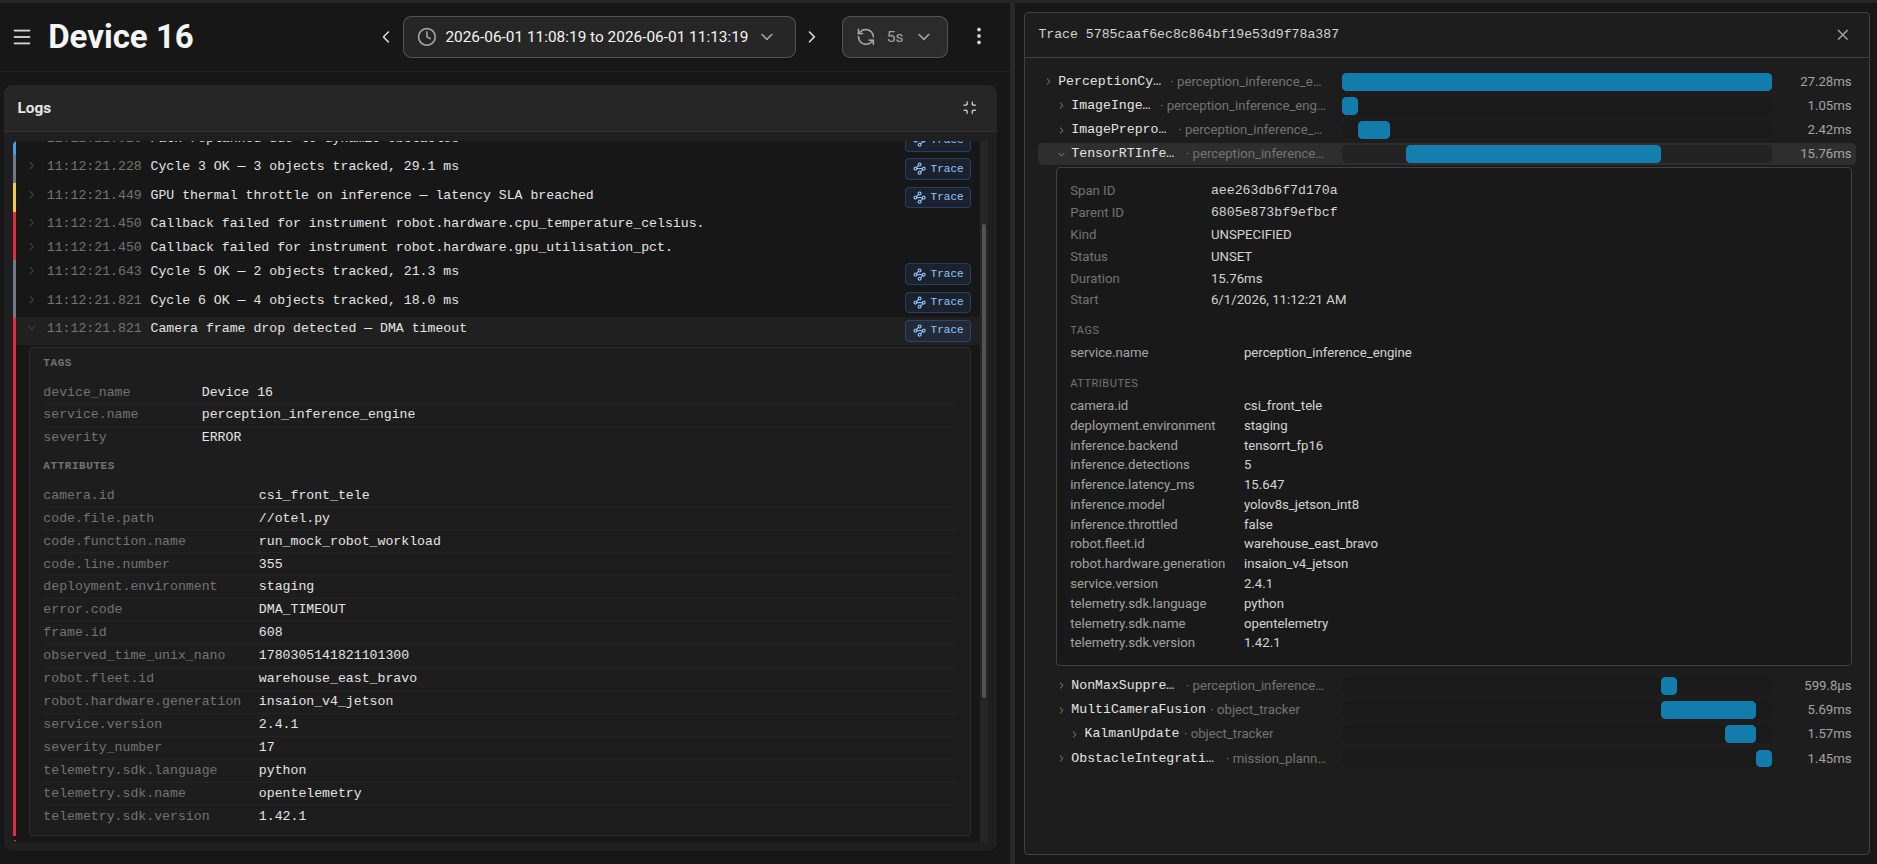
A major part of this release is the new trace exploration experience in the monitoring dashboard.
You can now:
- Browse recent traces and quickly inspect their root spans.
- Open a single trace in a focused drawer view.
- Read span timing in a waterfall layout sorted by start time.
- Expand spans to inspect IDs, status, tags, and attributes.
- Jump from contextual telemetry views into trace detail flow with less friction.
The net effect is simple: when you see a suspicious log line or anomaly, you can follow the request path and isolate where latency or errors started, without losing context.
One-Click Device Configuration for OTel
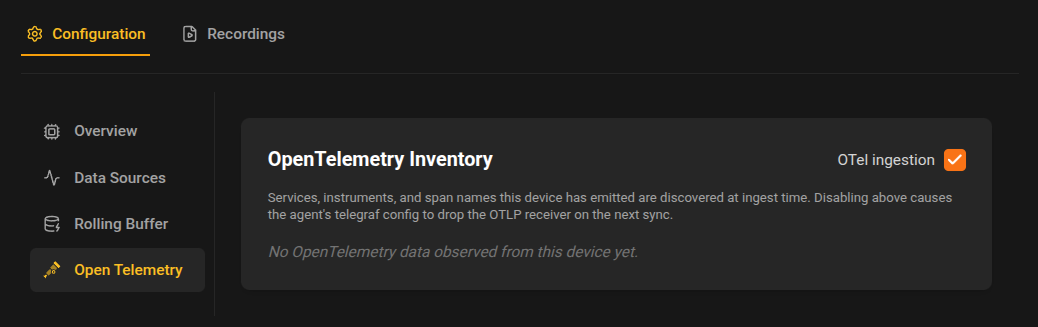
We also redesigned the device-side OTel configuration flow to be intentionally simple.
On the Device Configuration page, operators now get:
- A single OTel ingestion toggle.
- Read-only service inventory of discovered OTel metrics, logs, and traces.
- Immediate UI consistency through standard device update flow.
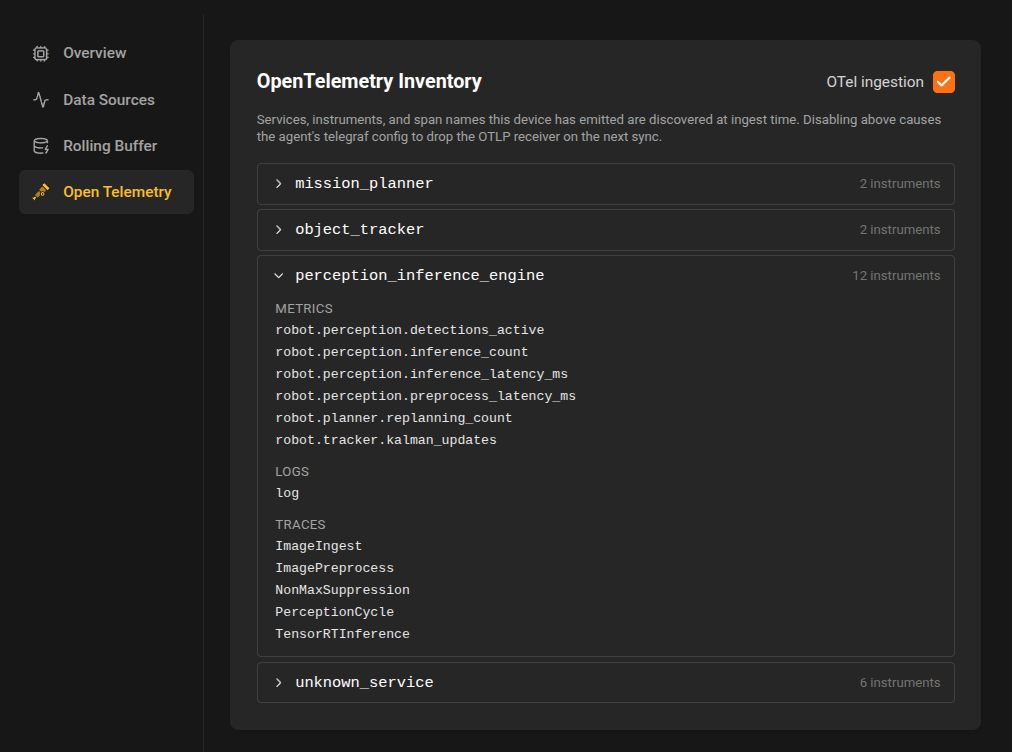
When enabled for a device, the agent updates its Telegraf OTel input configuration and reloads safely. When disabled, the OTel drop-in is removed from active ingestion.
Result: feature-rich telemetry plumbing under the hood, one-click control in the UI.
Why This Release Matters
OpenTelemetry support in v0.8.4 is not just a transport change. It is a workflow change:
- You instrument once using open SDKs.
- You ingest metrics, logs, and traces in one system.
- You pivot from symptom to causality using the new trace waterfall experience.
- You control adoption per device with a single toggle.
For teams running heterogeneous fleets and custom workloads, this closes a major observability gap while preserving future portability.
Release Summary
Insaion v1.1.19 introduces:
- Insaion Agent v0.8.4 with OpenTelemetry ingestion for metrics, logs, and traces.
- A new tracing exploration workflow with waterfall detail.
- One-click OTel enablement on device configuration.
This is the foundation for faster debugging with open tooling, portable instrumentation, and clearer operational insight.